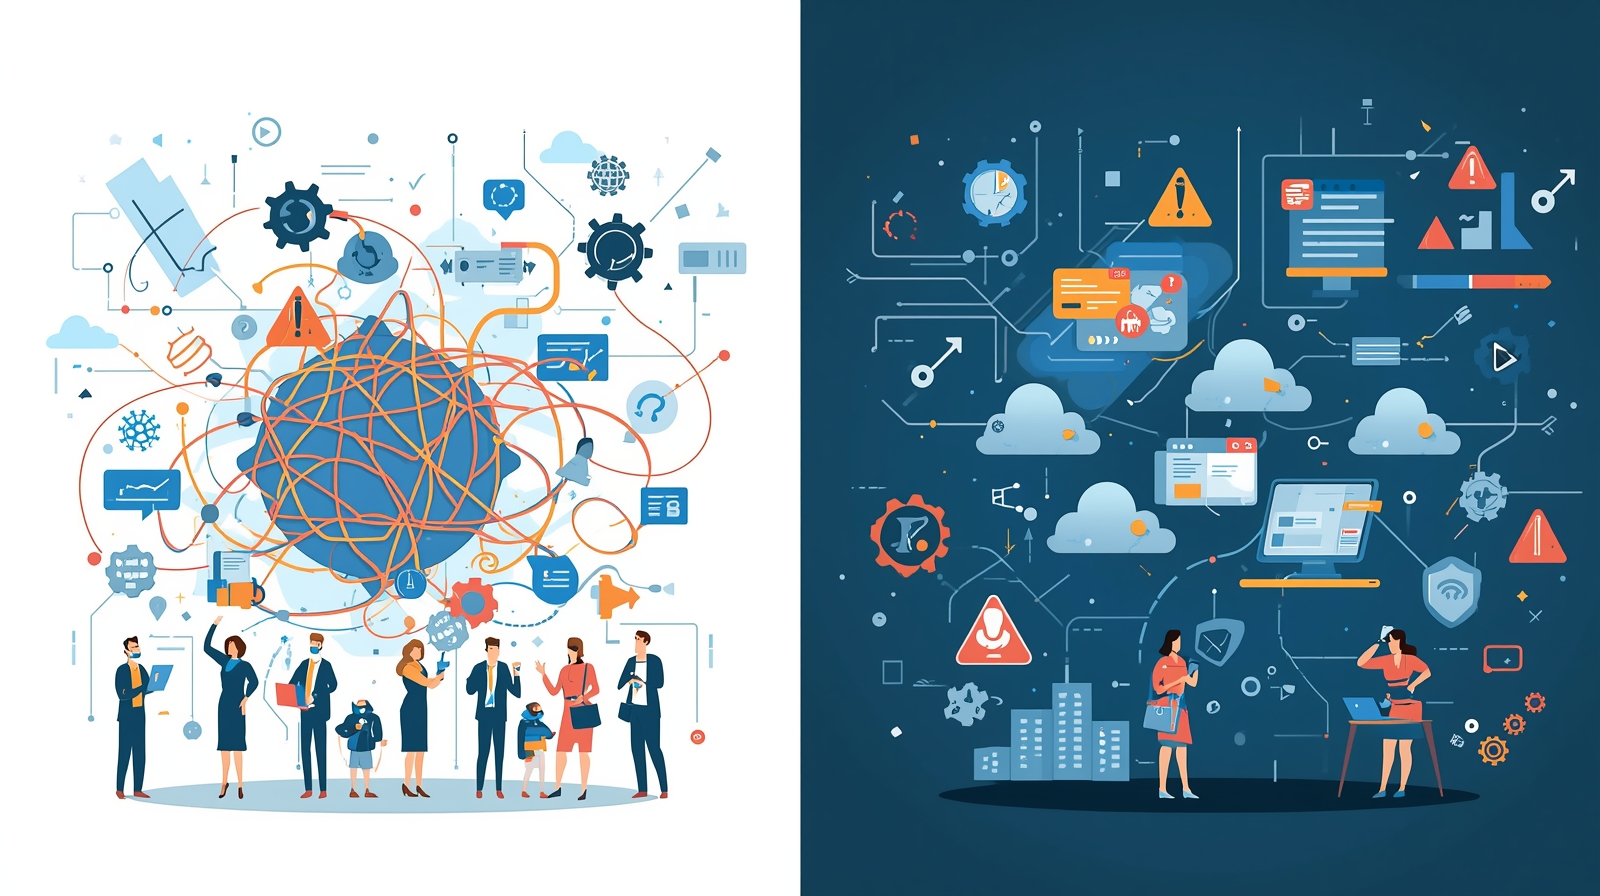

In the era of digital transformation, B2B companies are swimming in data—from customer behavior and sales performance to market trends and operational metrics. Yet, despite the volume, many struggle to derive actionable insights that lead to measurable business improvements. The challenge isn’t the lack of data, but how to make sense of it.
This article outlines practical steps and strategies to transform raw B2B data into meaningful insights that drive performance and growth.
1. Identify Key Business Objectives
Before diving into data, clarify what success looks like for your organization. Are you aiming to improve lead conversion, shorten the sales cycle, increase customer retention, or reduce churn? By tying your data efforts to clear KPIs (key performance indicators), you prevent analysis paralysis and ensure relevance.
Tip: Align stakeholders around a common set of business questions. This creates focus and enables prioritization of data initiatives.
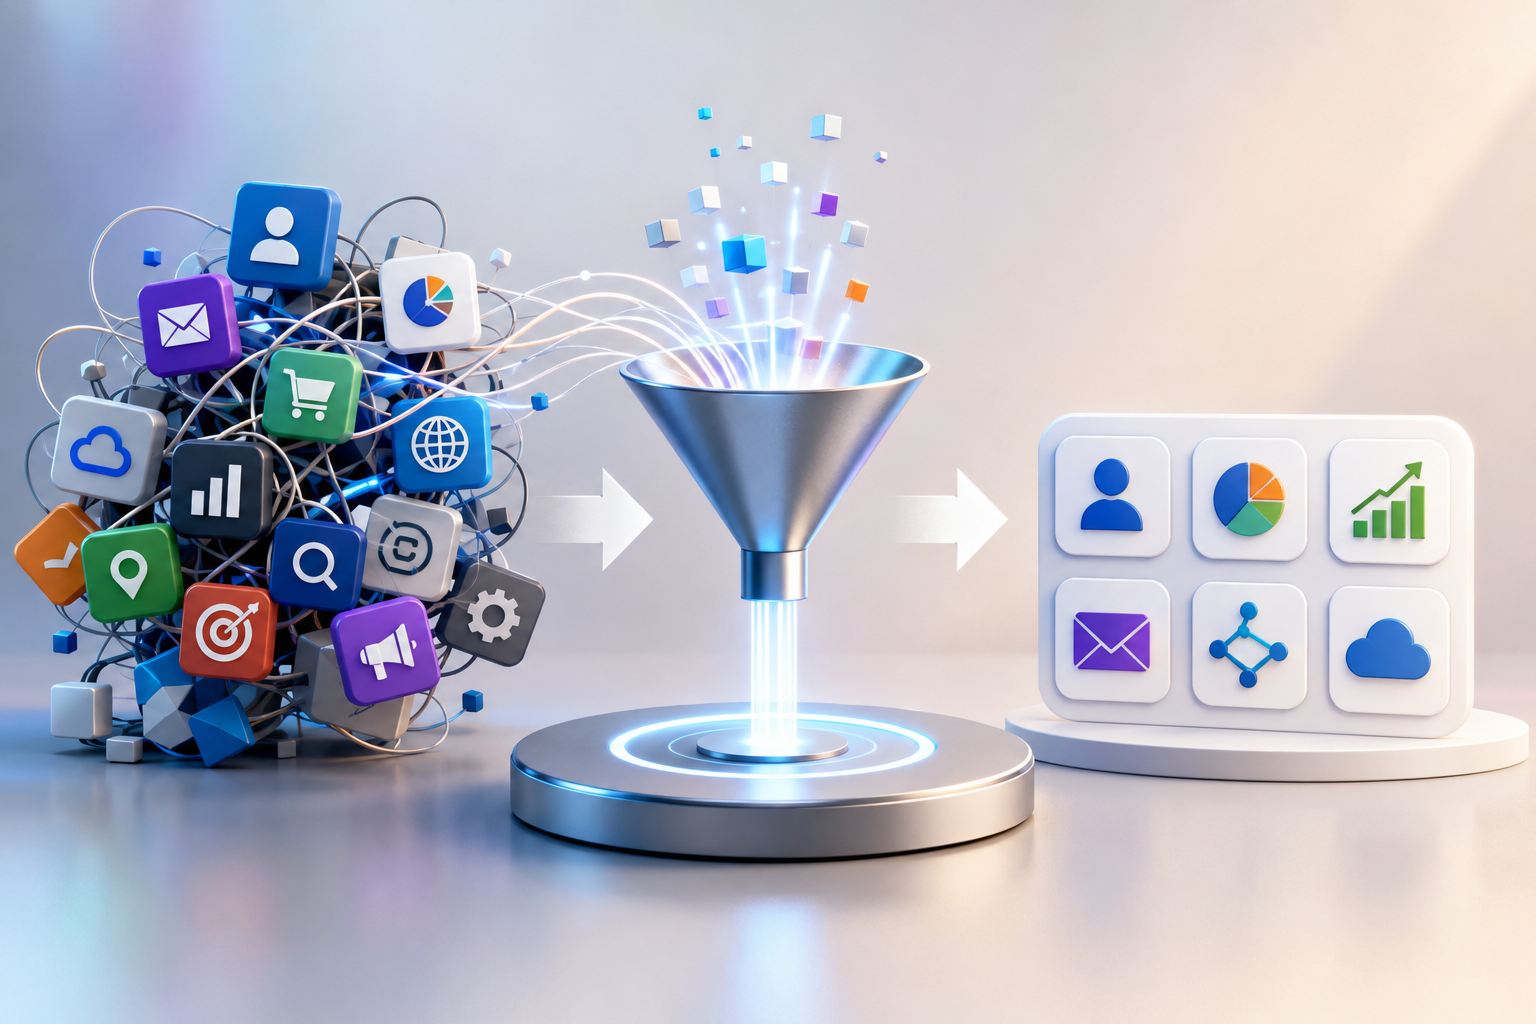
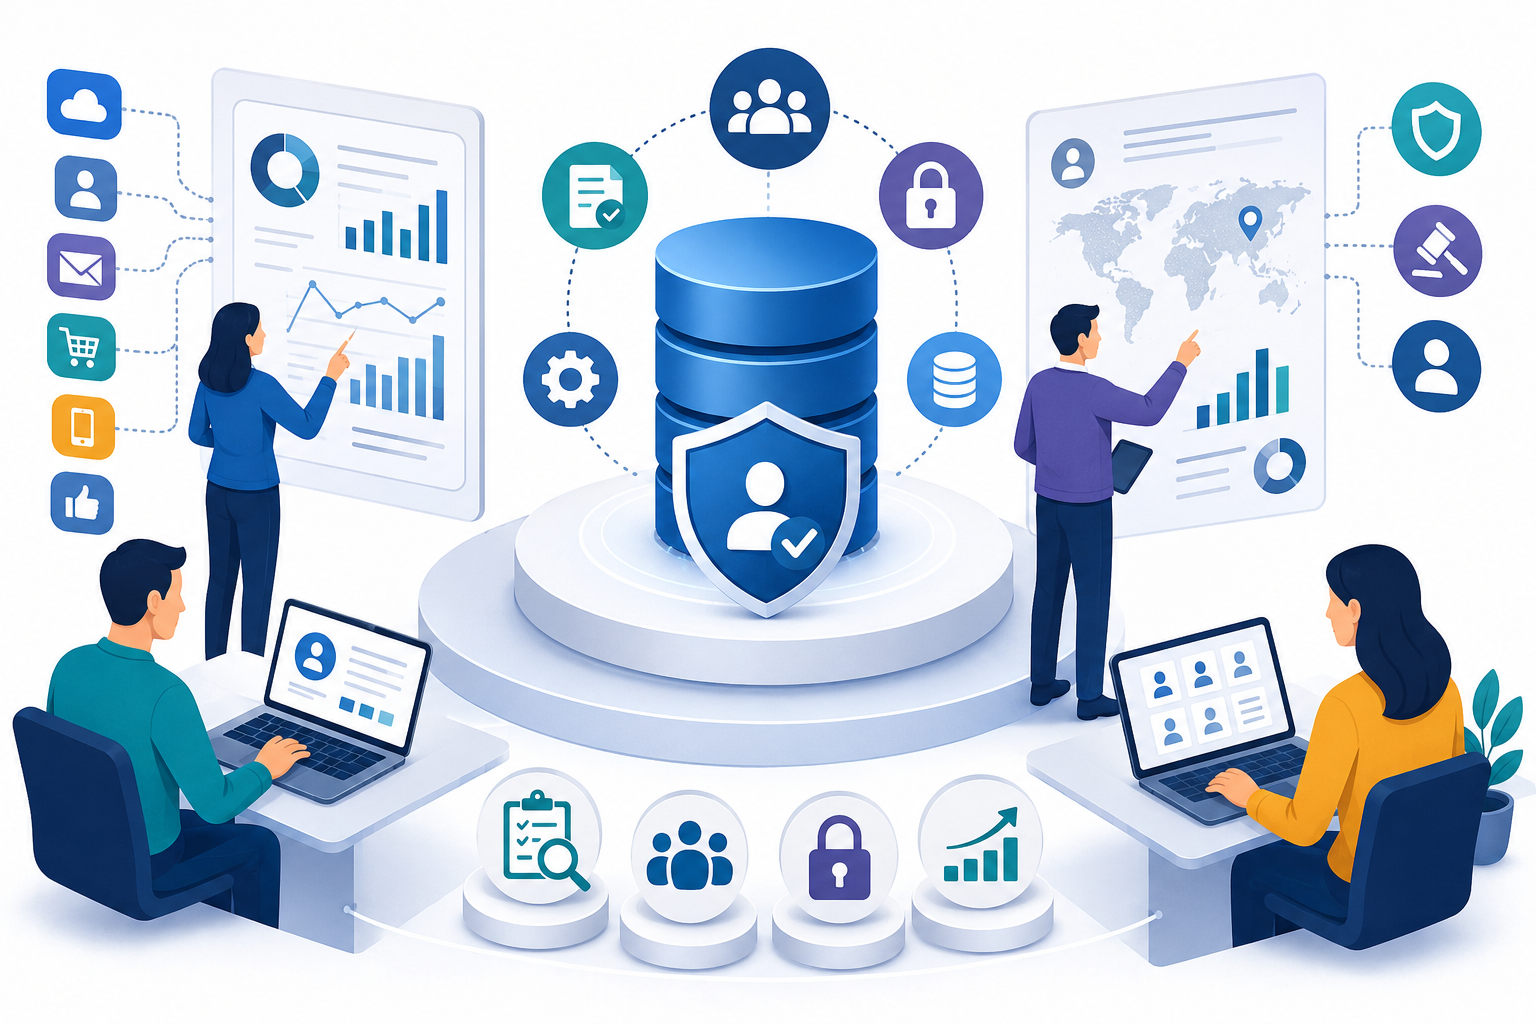
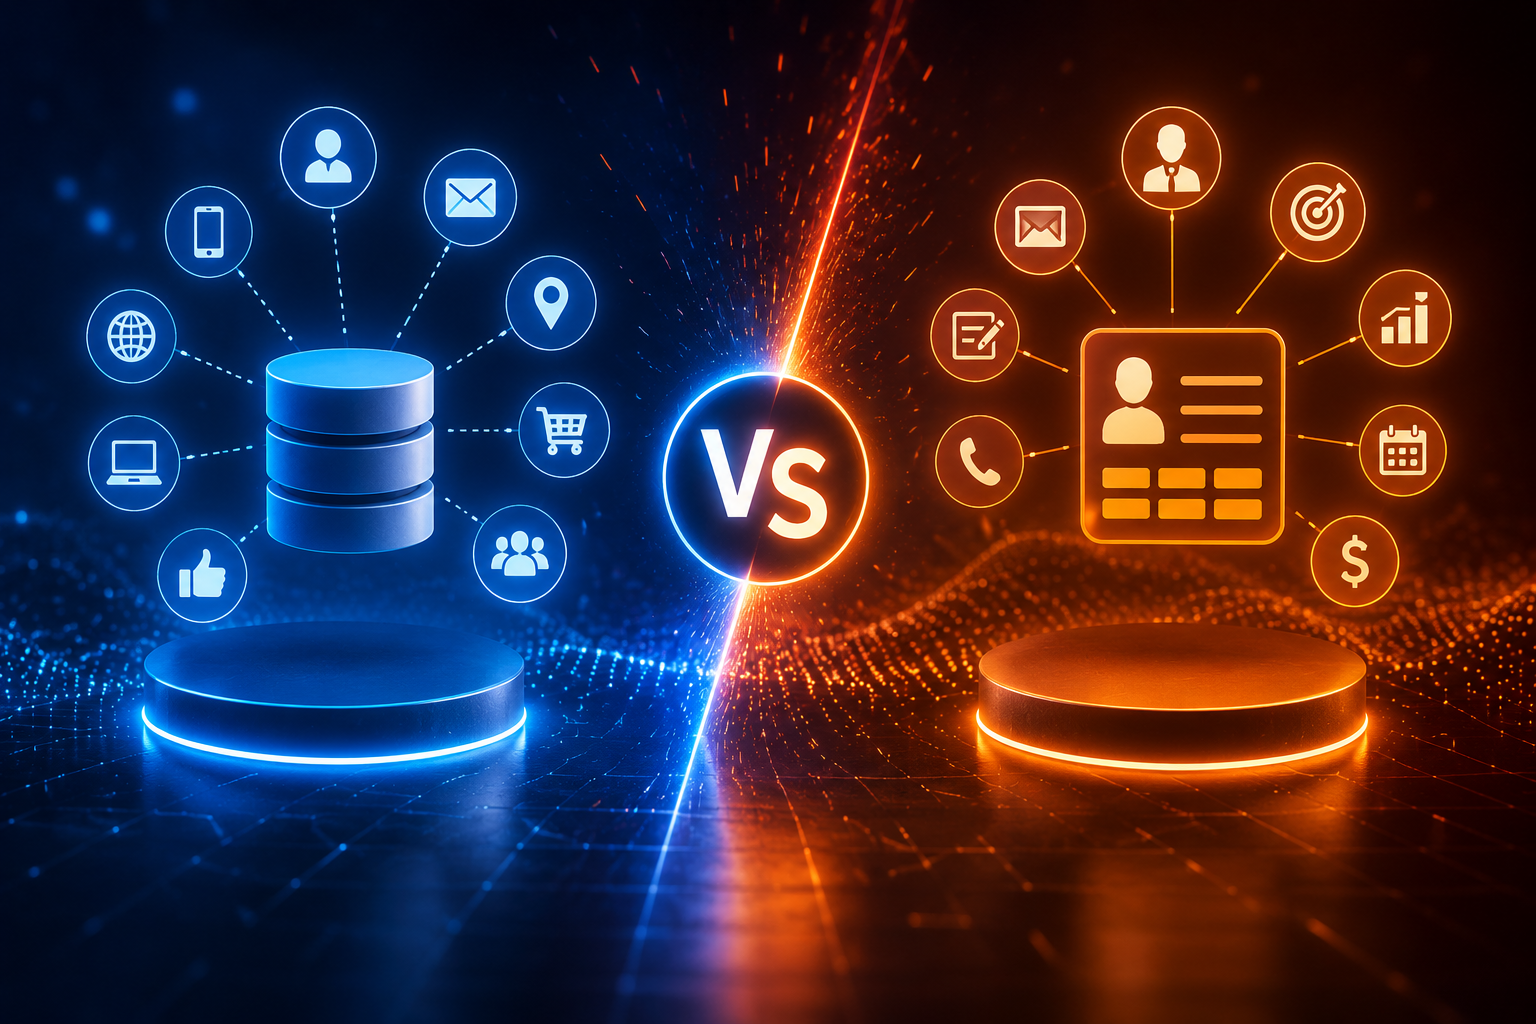
2. Consolidate Your Data Sources
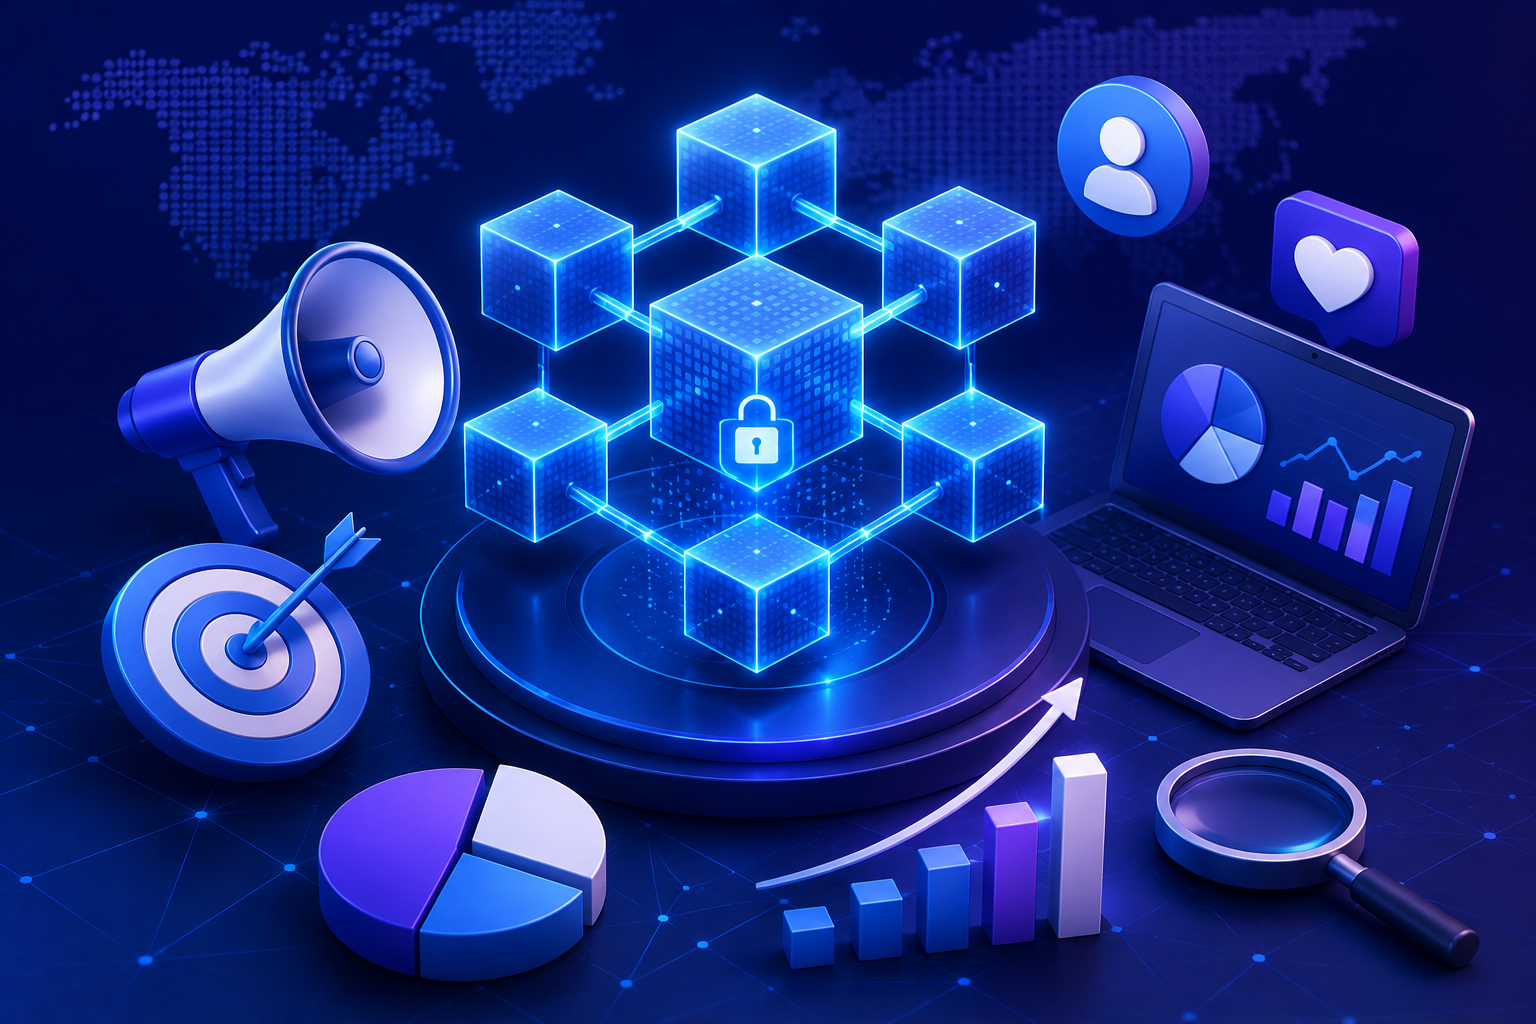
B2B businesses typically manage data across multiple systems—CRM platforms, marketing automation tools, customer support software, ERPs, and more. Disconnected data creates silos and hinders analysis.
Solution: Invest in data integration platforms or data warehouses that centralize information. Tools like Snowflake, Segment, and Fivetran can streamline this process.
3. Ensure Data Quality
Poor data quality leads to faulty insights. This includes duplicate entries, incomplete records, and outdated information.
Actions to take:
- Standardize data entry protocols.
- Set up validation rules.
- Regularly audit and clean your data sets.
Clean, reliable data is the foundation for trustworthy analysis.
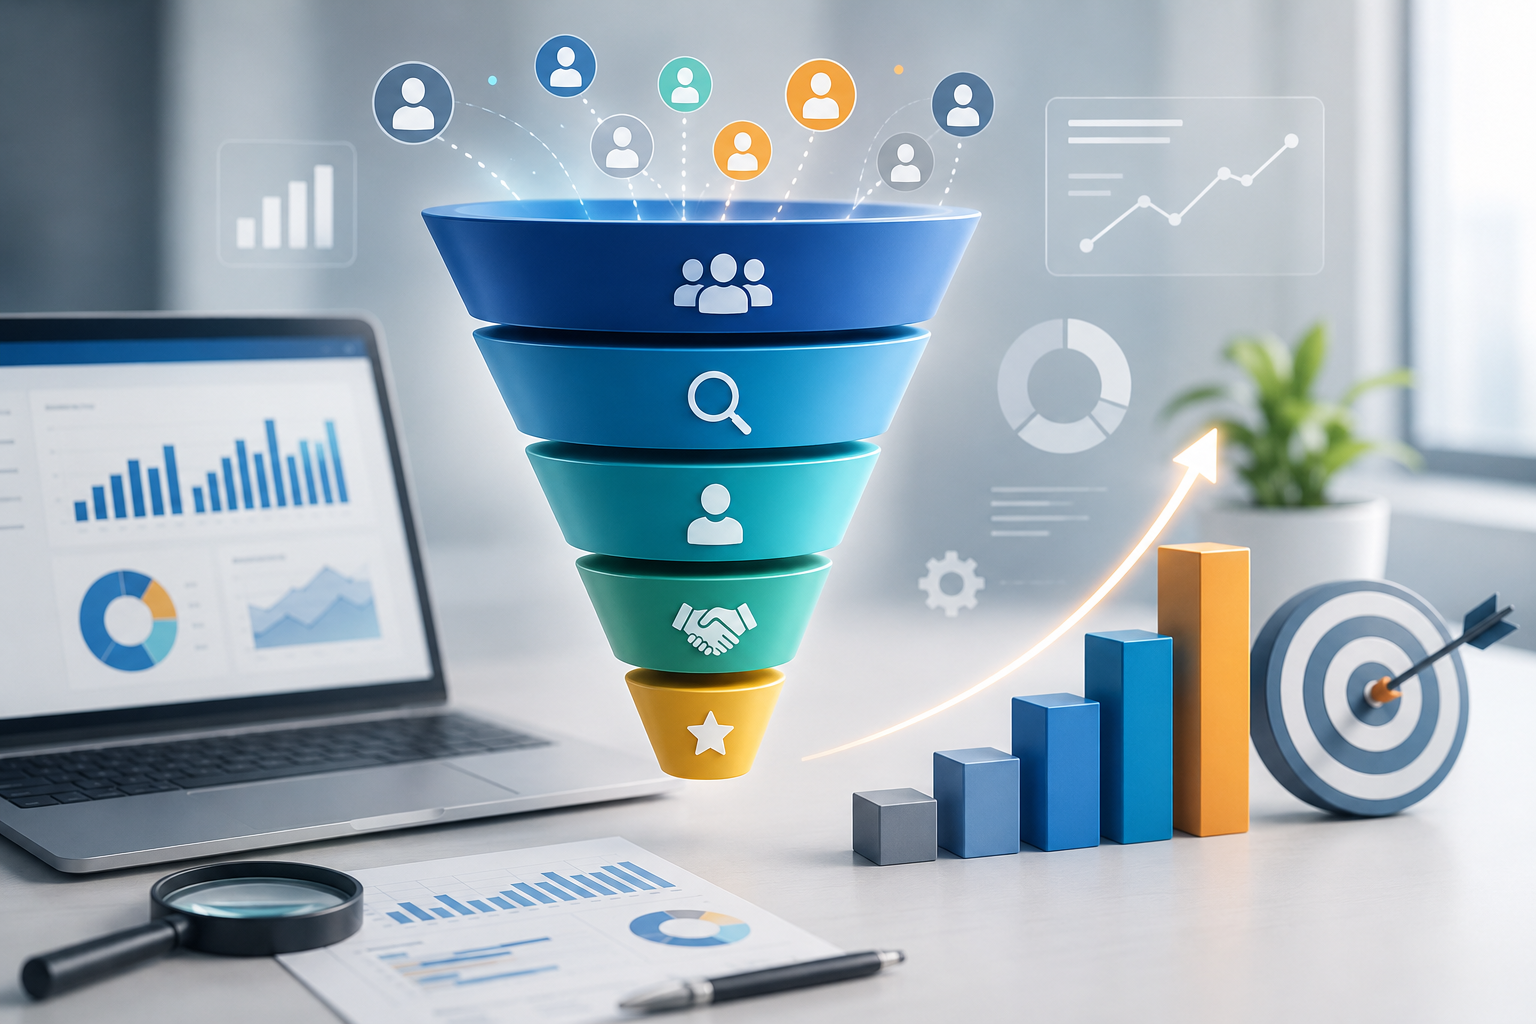
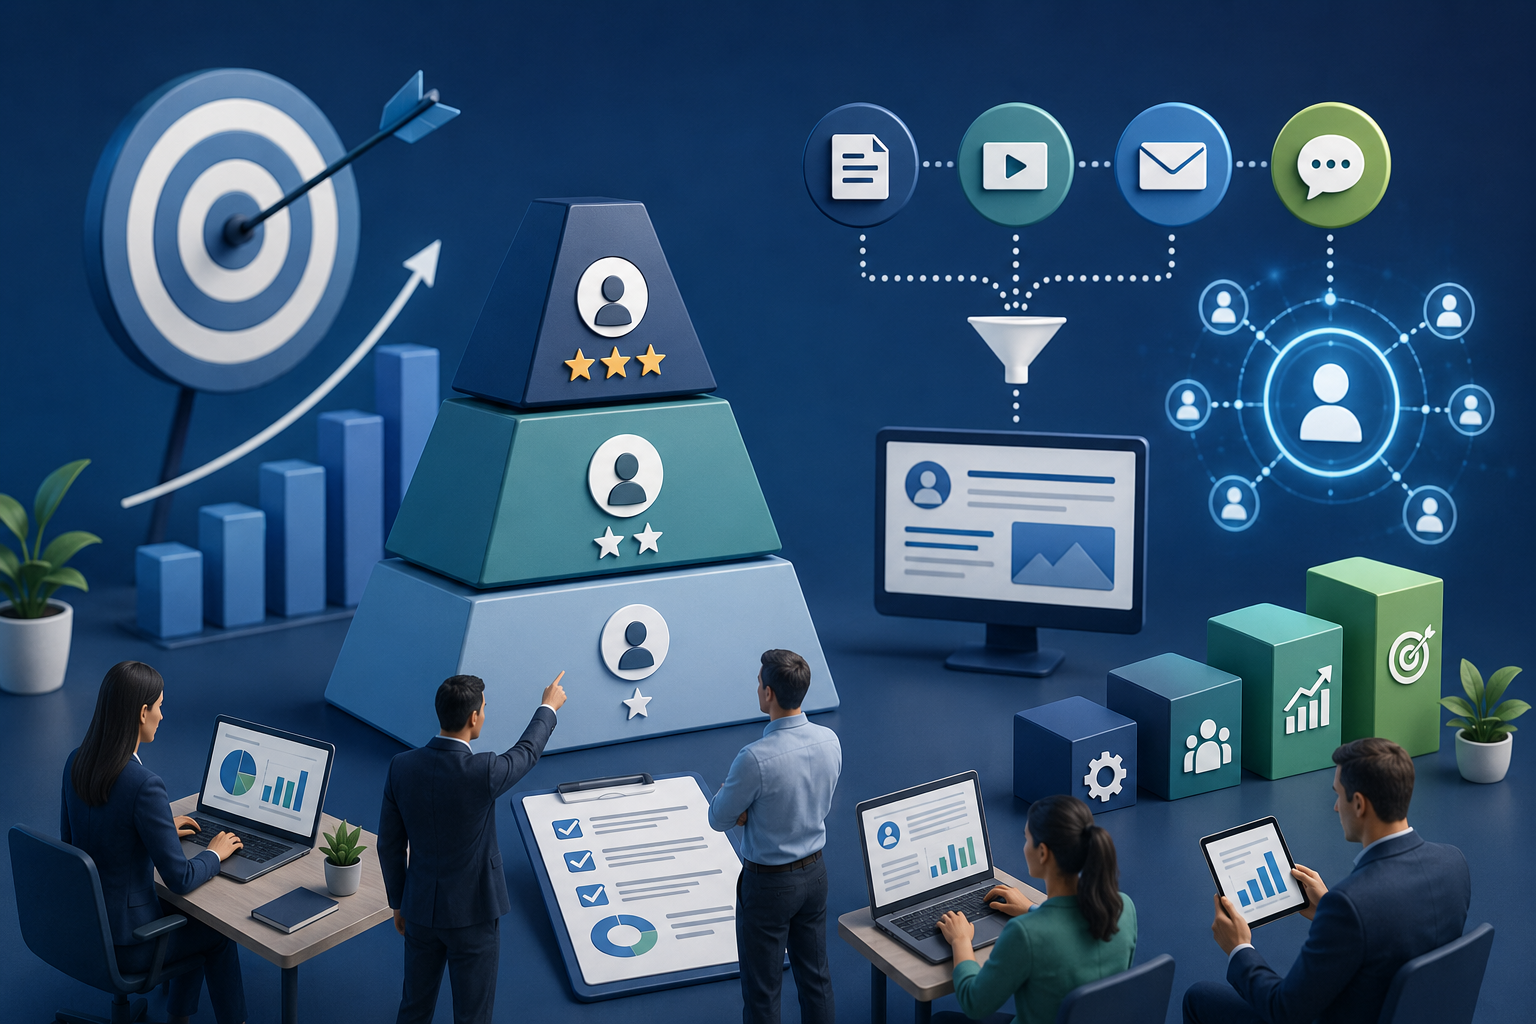
4. Segment for Deeper Insights
Not all customers or prospects are the same. Segmenting your data allows you to understand distinct patterns and needs among different groups.
Common B2B segmentation dimensions:
- Industry
- Company size
- Buying stage
- Product usage behavior
- Account potential (based on firmographic or intent data)
Outcome: Tailored marketing, personalized sales outreach, and more accurate forecasting.
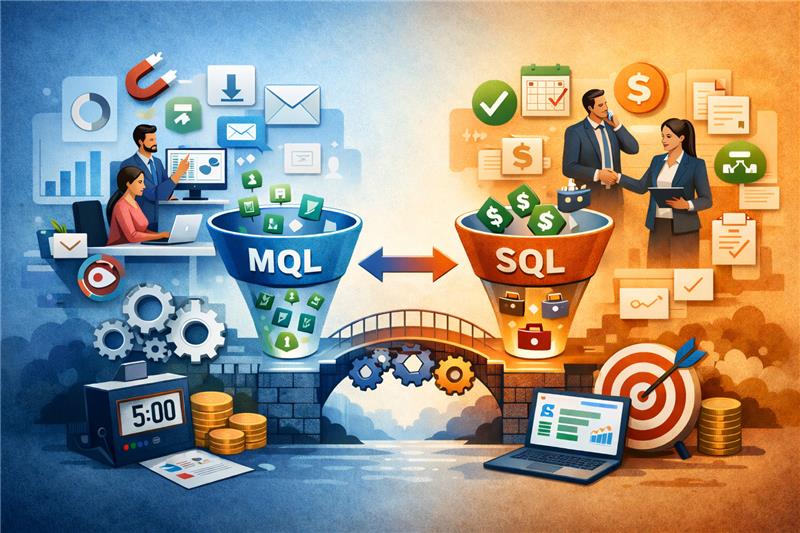
5. Leverage Predictive Analytics
Advanced analytics can help forecast trends, predict customer behavior, and proactively identify risks or opportunities.
Examples:
- Use lead scoring models to prioritize high-value opportunities.
- Predict churn risk by analyzing customer engagement and support ticket data.
- Forecast revenue based on pipeline stages and historical conversion rates.
Machine learning and AI tools like Salesforce Einstein, HubSpot AI, or custom models in platforms like Python and R can amplify this capability.
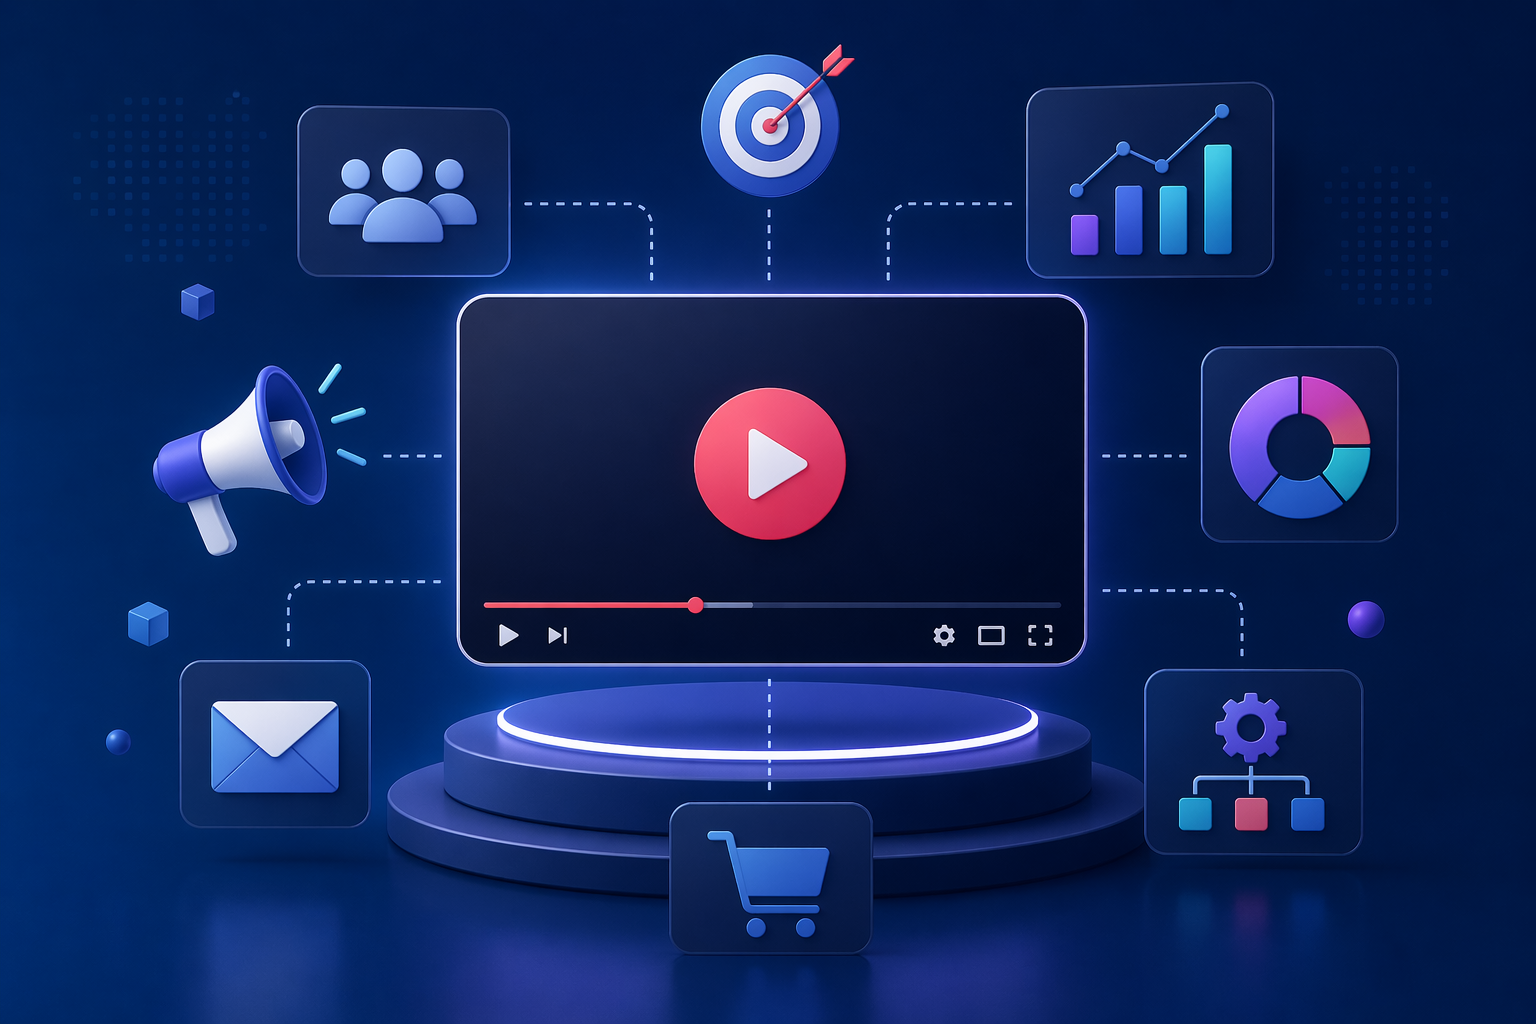
6. Visualize for Clarity and Action
Raw numbers often obscure meaning. Visual dashboards allow stakeholders to quickly understand performance and make decisions.
Best practices:
- Use clear, non-cluttered visuals (charts, heatmaps, funnels).
- Build role-specific dashboards (e.g., sales leaders vs. marketing teams).
- Highlight anomalies or trends that need immediate attention.
Tools like Tableau, Power BI, or Looker are popular choices for B2B visualization.
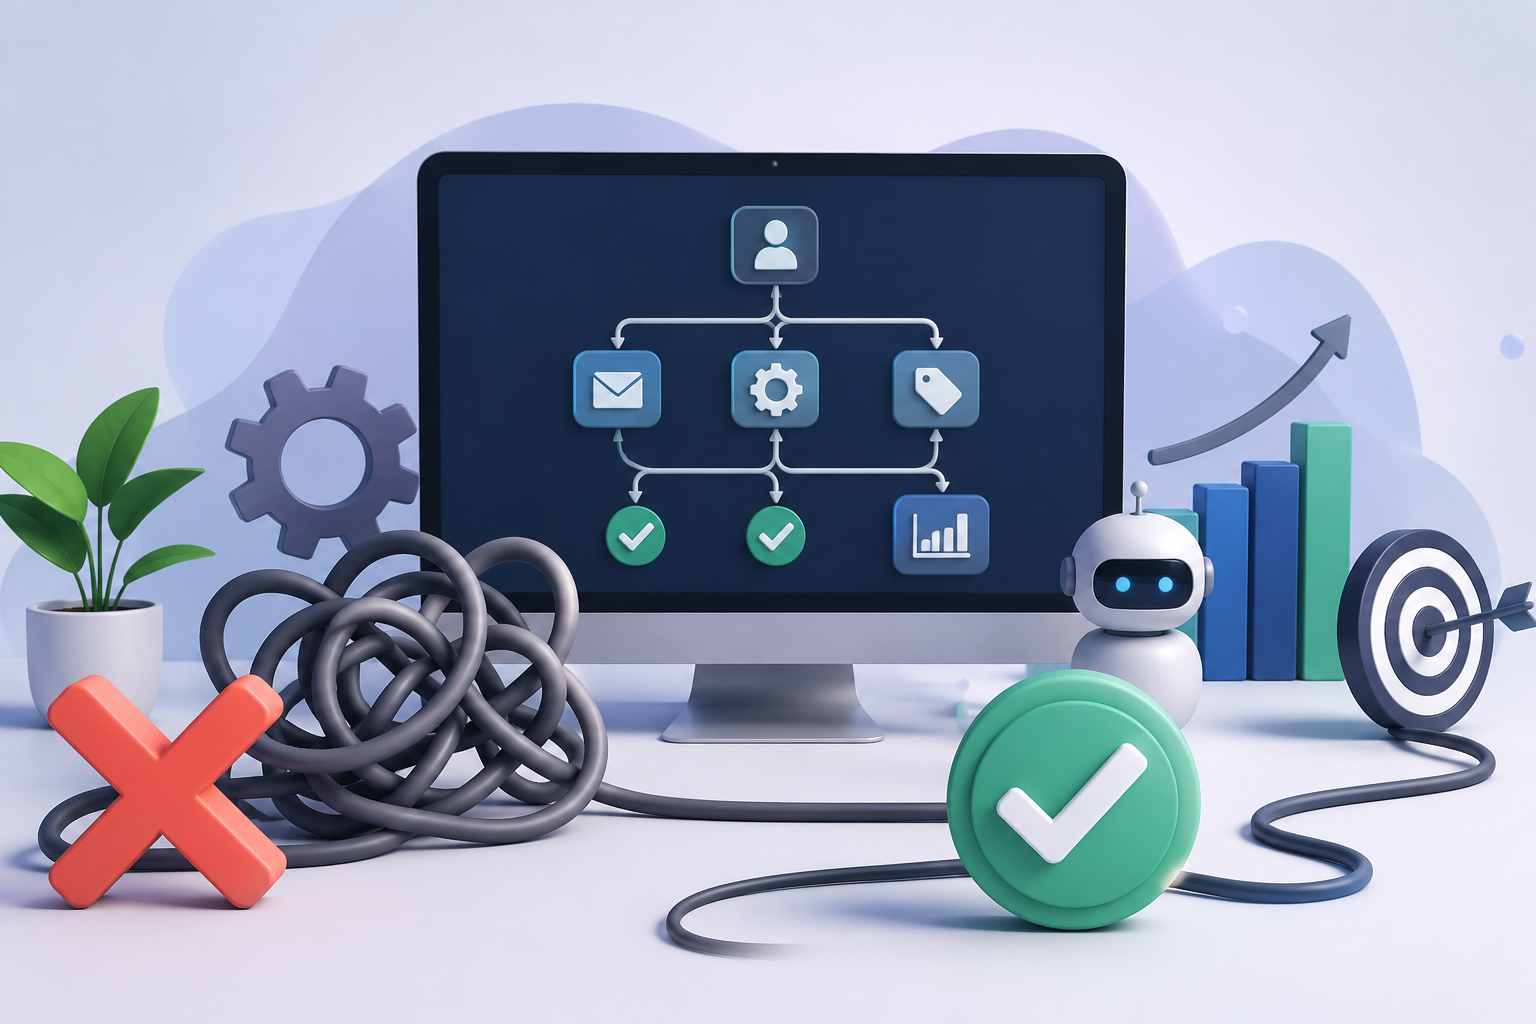
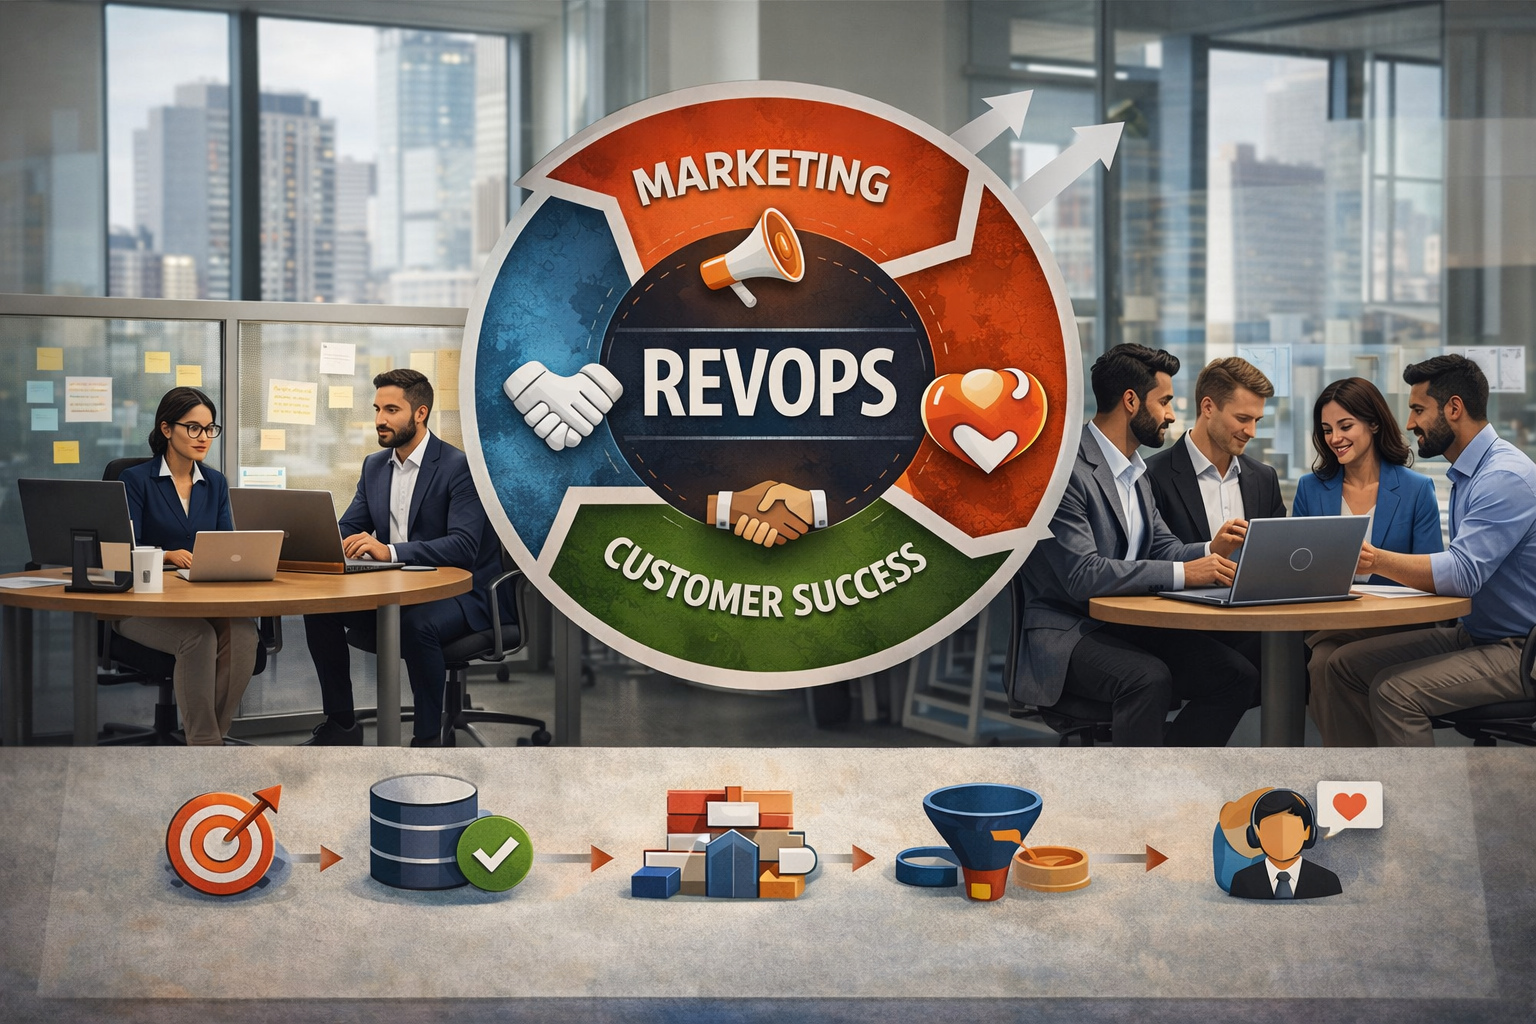
7. Close the Loop Between Data and Execution
Insight without action is wasted. Establish feedback loops where insights are regularly discussed, tested, and acted upon by business teams.
Examples:
- Weekly pipeline reviews powered by real-time CRM dashboards.
- Campaign tweaks based on attribution data.
- Customer success strategy adjusted based on product usage analytics.
Conclusion
Making sense of B2B data isn’t just about having advanced tools—it’s about asking the right questions, structuring data effectively, and building a culture that embraces data-driven decision-making. When done well, data becomes more than a resource—it becomes a strategic asset that fuels smarter business growth.